
Introduction:
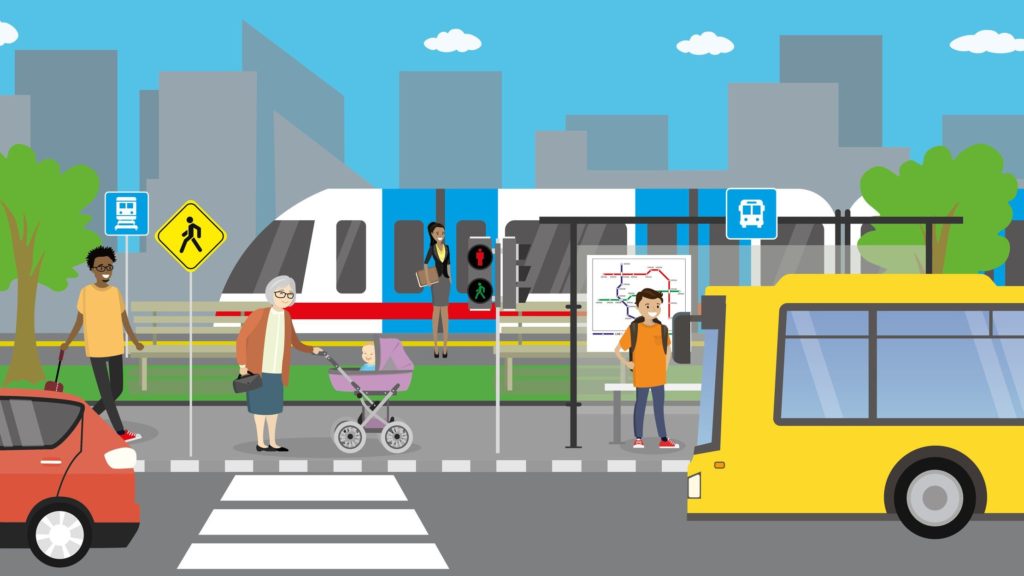
Traffic congestion is growing as the population increasing in urban regions. Growing public transportation is a constant challenge for the urban transportation authority. More cities have realized that public transport modes are more efficient and manageable than personal vehicles. The concerned administration is developing transportation infrastructure viz. metro lines, more buses on road. This increasing number of public transportation networks need to be operated efficiently.
To improve public transport service transport planners started considering data retrieved from automatic vehicle location systems (Furth et al. 2006), smart cards (Neema et al. 2015), and mobile phones (Calabrese 2011). According to Bregman (2020), social media-generated data such as Facebook, Twitter, and Flickr are useful in terms of yielding public transport data. Devices such as Bluetooth and Wi-Fi trackers provide new insights into various locations viz. stations and vehicles (van den Heuvel et al. 2015). The developing transportation infrastructure can be managed using a data-driven web application. However, as of today, in the ‘Big Data’ era, urban transportation planning is not fully embraced. This generally consists of manual data collection which is then aggregated by an expert analyst into a standard city model. This is an expensive approach and unreliable because of partial data. Mapping such data is an enormous work in an urban region, allowing mobility dynamics within a city.
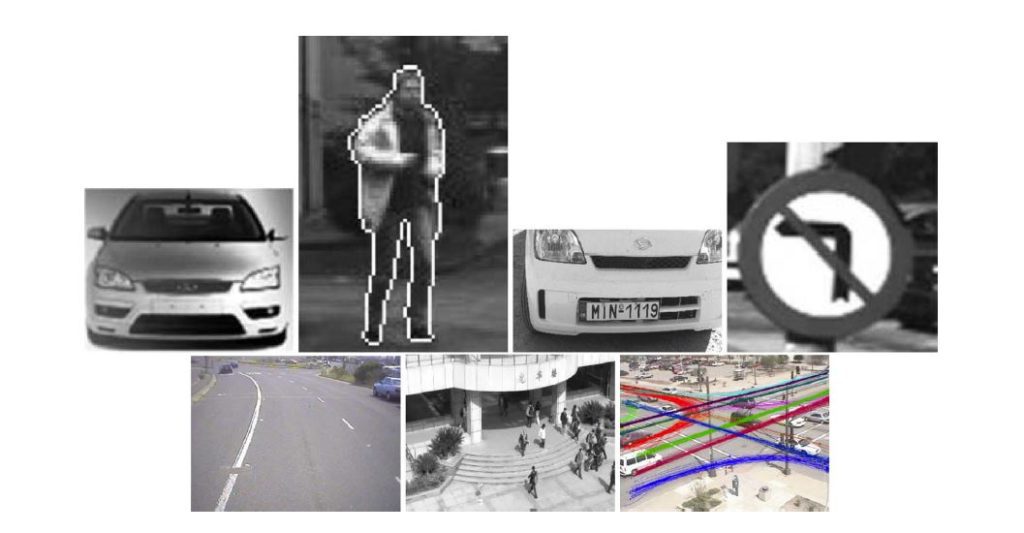
The presence of advanced technology in transportation systems allows the collection of millions of transactions every day. Web application techniques, machine learning, and stochastic model data can be used for a data-driven approach to urban mobility. These model models have learned automatically from the collected data. Furthermore, these models can then be applied within simulation systems with much higher precision, increased reliability for the predicted impact of a change with low cost.
Data-driven models are inferred from big amounts of data.
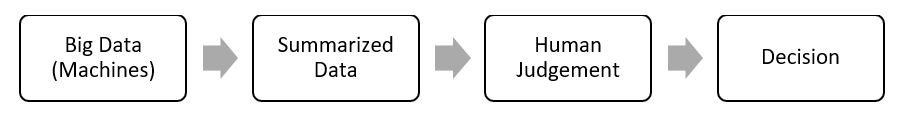
Data-Driven Decision-making Model:
Machine learning does the tasks of supervised classification, unsupervised classification, and regression. This trick helps in decision making.
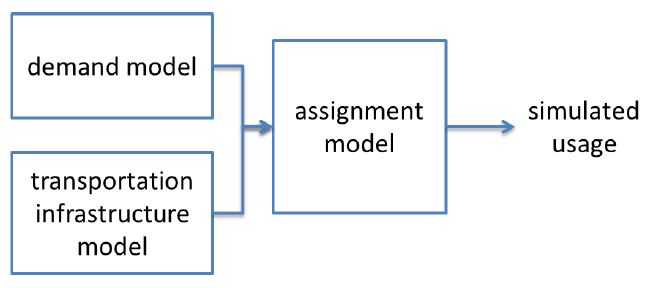
Transportation system simulation:
There is a demand model which describe different transportation need for people within an urban area viz. public transport and road networks. This dimension represents origin-destination and time of the trip. The demand model and assignment model define a transportation system within the area. The data-driven model approach could be used for modeling demand and assignment.
Improving Public Transportation:
To improve public transport, identification and analysis of unwanted variation in the transport service and the main causes of disturbances must be understood. A tool has been taken to understand how data-driven application plays important role in improving the public transport system.
The GOVI-tool:
Netherland developed a tool: GOVI-tool that translates data into information and knowledge. The database of this tool consists of the arrival and departure times of all trips and stops in the state. This implies big data sets. The tool calculated actual dwell times, punctuality, actual departure, arrival, and travel time. All information could be presented per stop, period, and direction wise. The tool also identified bottlenecks and easily found its way in service delivery. Driving, dwelling, and punctuality related data were generated to gain insights into the maximum improvement potential. This tool prevented expensive and lengthy field observations and prevented vehicles to depart ahead of schedule. Thus, the tool was used to analyze bottlenecks with regards to travel time and service reliability.
Advantages:
A data-driven approach can lead to an efficient practice for planning and understanding mobility. There is no need for manual data collection to produce an analysis that required a huge budget of planning departments of transportation authorities. The big data application system has the potential for cost reduction and also helps process faster. Another advantage is that data-driven web applications up-to-date transactional data more accurately daily. It also helps in identifying behaviors that are taken into consideration for evolutions in a change of behavior. The technology helps in making payment ease and cheaper i.e. smartphones or credit cards. The transactional data covers the whole population of transport systems users which is important for training. Complete coverage allows for cross-validation on time, space, and population. This reduces a lot of the uncertainty and creates a positive effect on data accuracy. Combining data from all sources of transport modalities are correlated while applying holistically to an urban area. The data enables understanding the city to predict accurately with changes. Overall, it helps in an advanced public transportation management system.
Disadvantages:
Big data technologies emerged in 2000 within the e-commerce and social media companies. This is new to the public transportation system. Although its use started a lot of discussions in the Intelligent Transportation System community. The adoption in the field may take time. There is another obstacle to the adoption of data-driven planning approaches. Despite the existence of a massive amount of data, it is not easily accessible and stored for very specific needs. The data are required to be normalized and standardized to simplify the interoperability between the operating systems and the planning systems. There is a user’s privacy issue identified. At the organizational level, organizations must regulate the exchange of this data to guarantee that the business sensitivity of these data and the users’ privacy is properly protected. The user of this technology requires understanding to configure data and interpret the results despite automatic application. This constitutes a paradigm shift of expertise of the transportation phenomena to predictive data analytics.
Example:
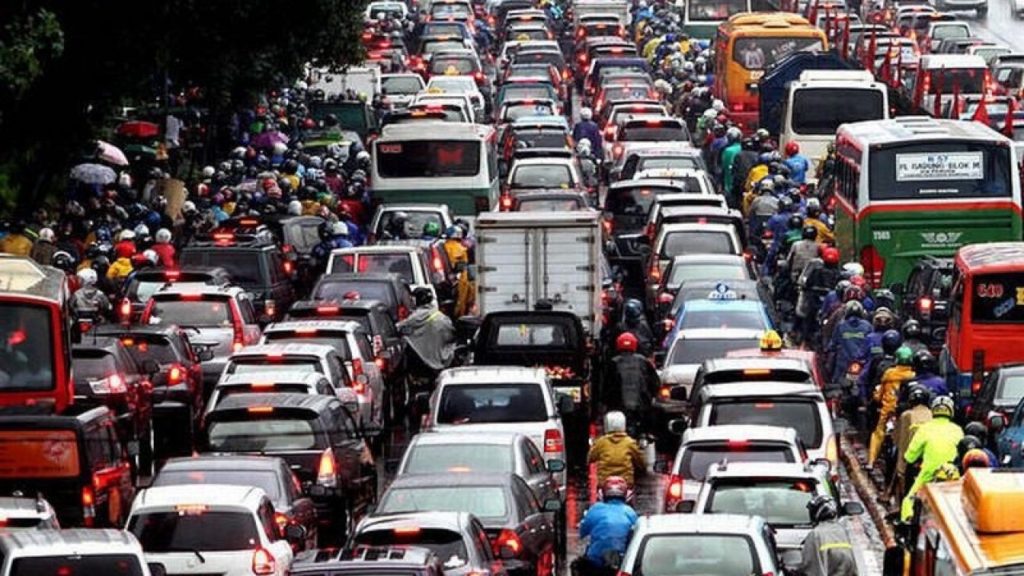
There was a traffic jam issue in Jakarta, Indonesia which made public transportation complicated and affected commuters. Realizing the issue, the Jakarta city government initiated an effort to improve public transportation services through Jakarta Smart City Initiative – it was big data analytics. The project collected relevant data/information through third parties, citizen crowds, and the government. This included various applications along with the city’s Bus Rapid Transit system, called TransJakarta. The application was designed to provide a fast-public transportation system information to its citizens. The purpose was to keep commuters informed on commuting times and reduce rush hour traffic. According to a report, there were 123.7 million passengers who used the bus service in 2016. The city started facing issues with the increasing number of passengers. Some challenges affected TransJakarta with unpredictable service frequency, travel times, and wait times. To understand the transportation challenges in the city, Jakarta Smart City analyzed real-time TransJakarta data with a partnership of Pulse Lab Jakarta to improve bus services. The project supported Jakarta city administration in its data-driven policy framing and implementation.
The project used GPS and passenger’s tap-in data to identify problematic locations in the city. TransJakarta used GPS devices that updated bus information every five seconds along with geo-location, time, and velocity. It also helped in identifying abnormal traffic behaviors and uncovered the slowest lanes. Based on the dataset, the city Government explored could origin-destination patterns that could improve in planning and services of public transportation.
The project enabled Jakarta Smart City to map problematic locations and reduced traffic jam issues. The project identified the number of hours between consecutive trips, types of bus lines, top destination lines, and top origin-destination at the city. The project determined the longest waiting time based on tap-in data and fleet GPS data. TransJakarta used the project findings to help improve route planning and regularity of service. City administration made improvements in their operations such as deploying officers and barriers to secure dedicated liens in typically congested areas and adding buses on certain routes. The insights generated by this project have been used to improve transportation planning and demonstrated the potential for developing analytical models to enhance public service delivery. The public transportation system in urban areas generates a huge amount of data. Each data source can provide significant sights to inform improvements in transportation services.
Conclusion:
Due to higher political expectations and a reduced budget, there is pressure on the public transport system to be improved and operated efficiently. There is the emergence of the use of data-driven web applications to identify inefficiencies, bottlenecks, and potentials in the public transport service. The mass of data collected in the transportation operations for understanding mobility needs and improving public transportation facilities in urban areas. Although there are advantages and disadvantages in the application system, the types of problems need to be tackled following the mentioned models. No doubt, it may take time, transportation systems can use big-data analyses properly for planning and implementation. The city can start with experiments in order two build some assessment of the outputs. Data-driven models facilitate the integration and accessibility of the operations data in the transportation system. Software tool enables operators and authorities to perform operational analysis to identify bottlenecks and plan accordingly. Thus, data-driven web applications improve the public transportation system in urban areas.
References:
- Neema N, Hickman M, Ma Z-L (2015) Activity detection and transfer identification for public transit fare card data. Transportation 42(4):683–705.
- Furth PG, Hemily B, Muller THJ, Strathman JG (2006) TCRP Report 113: using archived AVL-APC data to Improve transit performance and management. Washington, DC.
- Calabrese F (2011) Estimating origin-destination flows using mobile phone location data. In: Pervasive computing, IEEE, pp 36–44.
- Bregman S (2012) Uses of social media in public transportation. Transit Cooperative Research Program (TCRP) Synthesis 99. Transportation Research Board, Washington.
- van den Heuvel J, Voskamp A, Daamen W, Hoogendoorn SP (2015) Using Bluetooth to estimate the impact of congestion on pedestrian route choice at train stations. In: Charaibi M (ed) Proceedings of traffic and granular flow ’13, Switzerland, pp 73–82.